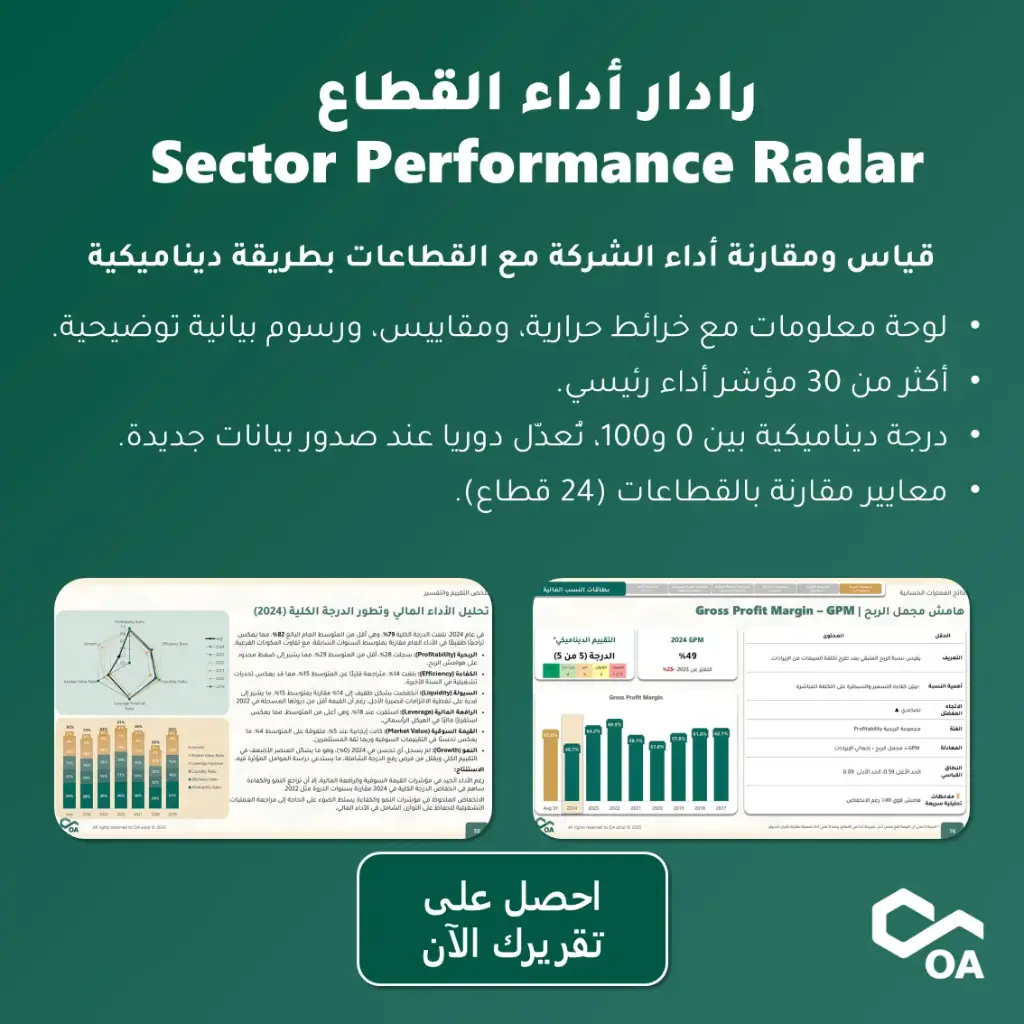


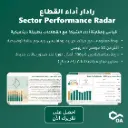


Sector Performance Radar
Unlock executive-level insights in minutes with our downloadable Dynamic Performance Radar.
What’s inside?
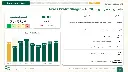
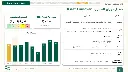
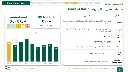
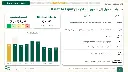
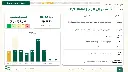
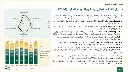
Fully interactive Excel dashboard with heat maps, radar charts, gauges, and sparklines.
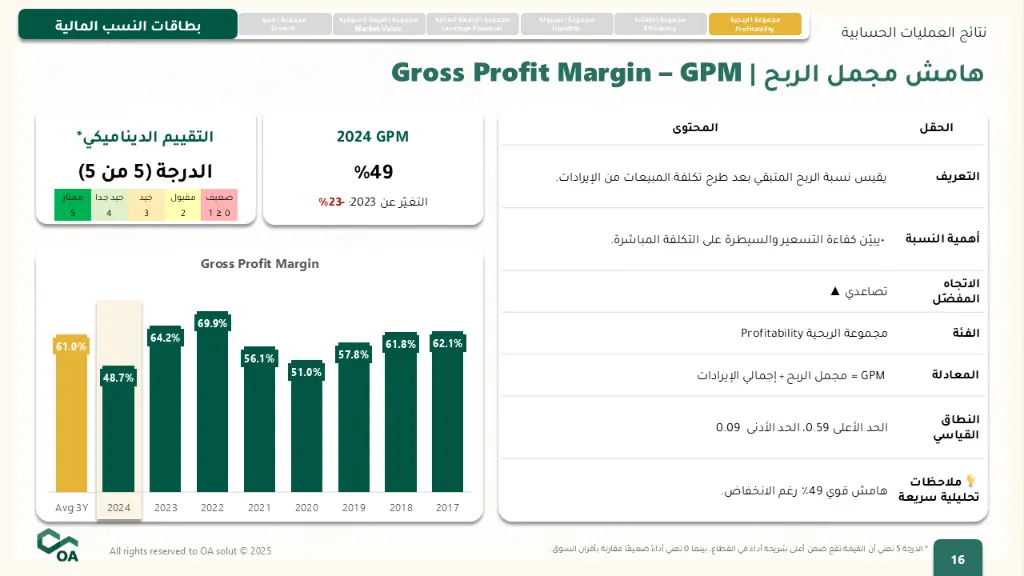
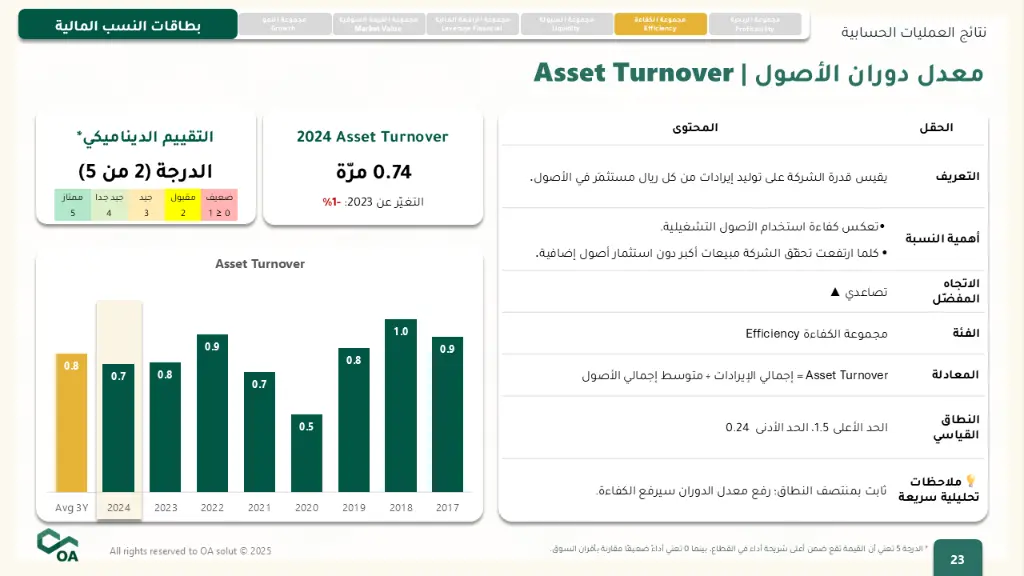
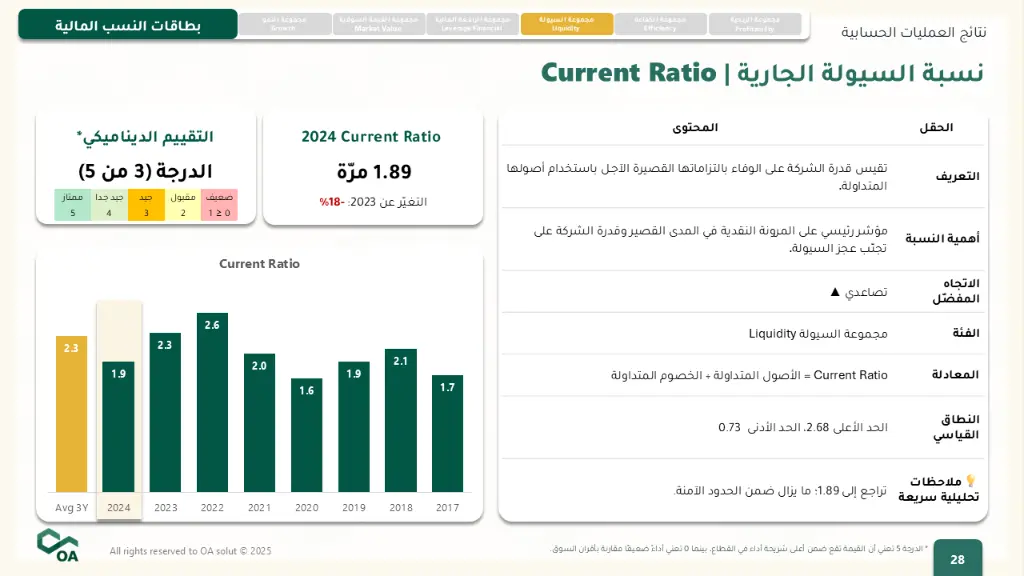
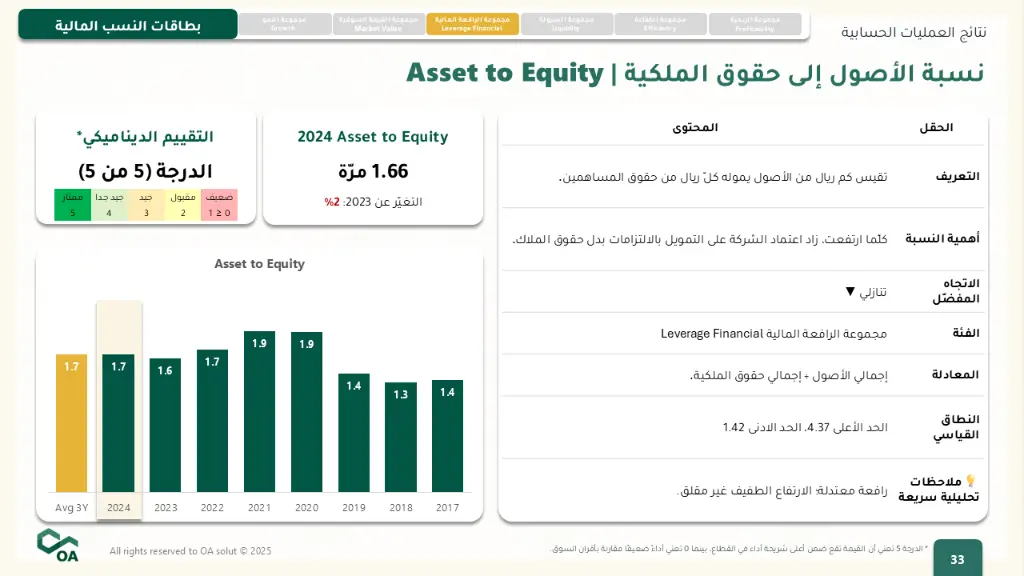
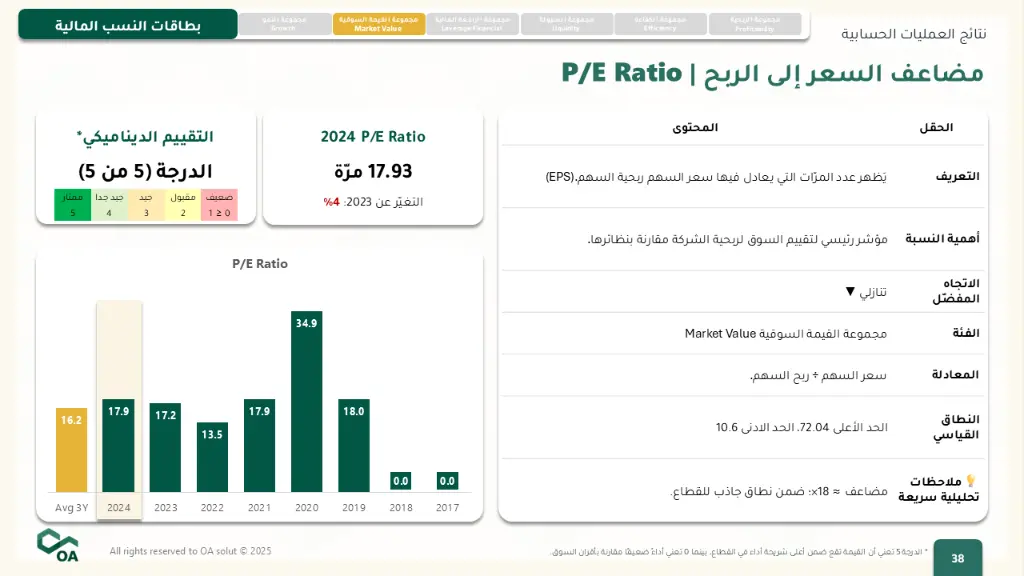
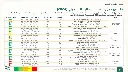
30+ KPIs grouped into profitability, efficiency, liquidity, leverage, growth, and valuation.
Dynamic 0-100 score that adjusts each quarter as new data is released.
Benchmarks versus the sectors (24 peers).
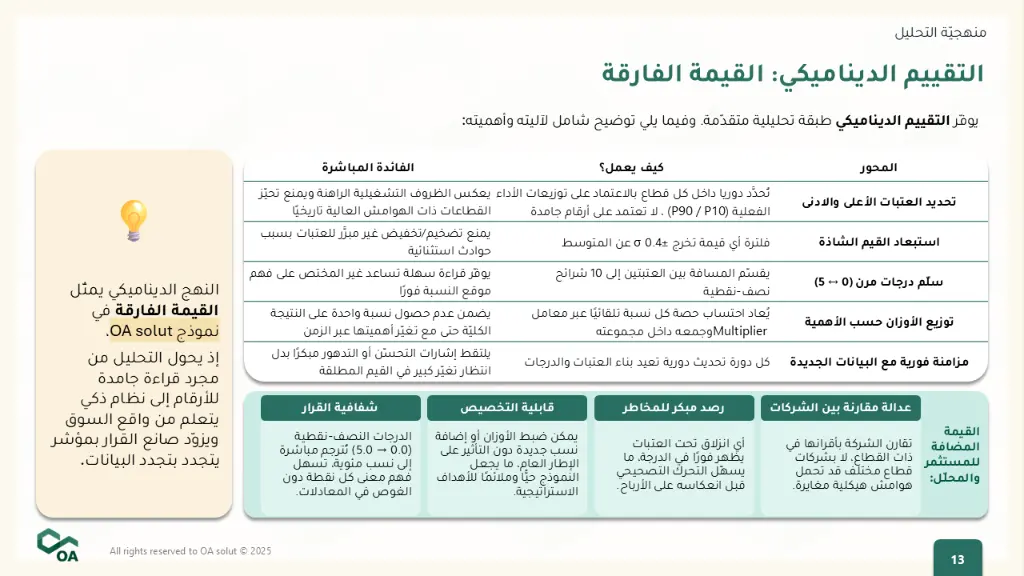
Clean data: outliers > 0.4 σ automatically excluded for fair comparison.
Perfect for:
• Board reporting and strategic planning • Competitor benchmarking • Academic research
Project Kick-off – Once your order is confirmed, we open a dedicated project space in our OA Solutions platform.
Alignment Call – We schedule a coordination meeting to clarify the scope, gather your latest financial statements, and agree on key deliverables.
Analysis & Draft – Our analysts build the Dynamic Performance Radar tailored to your data. Turnaround time: 2–4 weeks.
Review & Approval – You receive the draft report for feedback. Revisions are incorporated until final sign-off.
Project Closure – The approved report (Excel + PDF summary) is delivered, and the project is formally closed in the platform.
Need something sooner? Let us know during the alignment call and we’ll explore expedited options.
⚠️ Disclaimer
This report offers a structured analysis based solely on publicly available information.
It is not investment advice or a solicitation to buy or sell securities.
Always consult a licensed financial professional before making investment decisions.
Documents
Alternative Products
These other products might interest you